Content Marketing
Your job as a bank marketing professional is to ensure that important information about your institution gets out to customers, prospects, and the general media. Unfortunately, getting your message across is becoming more difficult as the average person receives numerous text messages and emails each day. Luckily, infographics are a fun way to benefit your content strategy. In this article, we’ll explain what infographics are, how to use them, and why they enhance your bank or credit union’s content marketing strategy.
What is an infographic?
As its name suggests, an infographic conveys information in a graphic format. The purpose of an infographic is to make data easily understandable at a glance. There are different elements you can incorporate into your infographics such as images, icons, text, charts, and diagrams. When it comes to your financial institution’s website and content marketing strategy, using infographics helps you convey a certain message or make educational content faster and easier to understand.
The three primary types of infographics include:
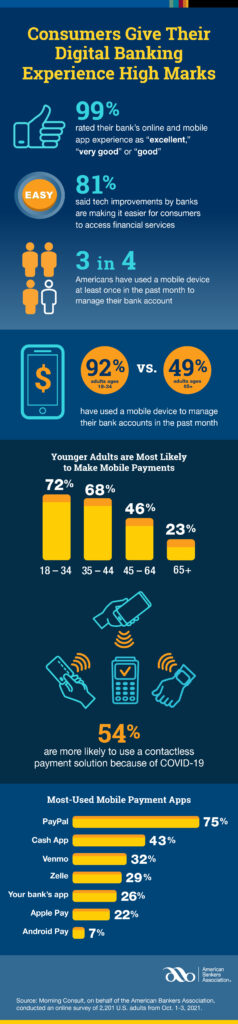
Statistical
This is one of the most common types of infographics to show data in an organized and easily digestible way. Statistical infographics should have compelling stories, be visually appealing, and contain useful data. Although data can be boring to look at on its own, when presented creatively through an infographic, you’re likely to have better luck attracting the attention of the audience.
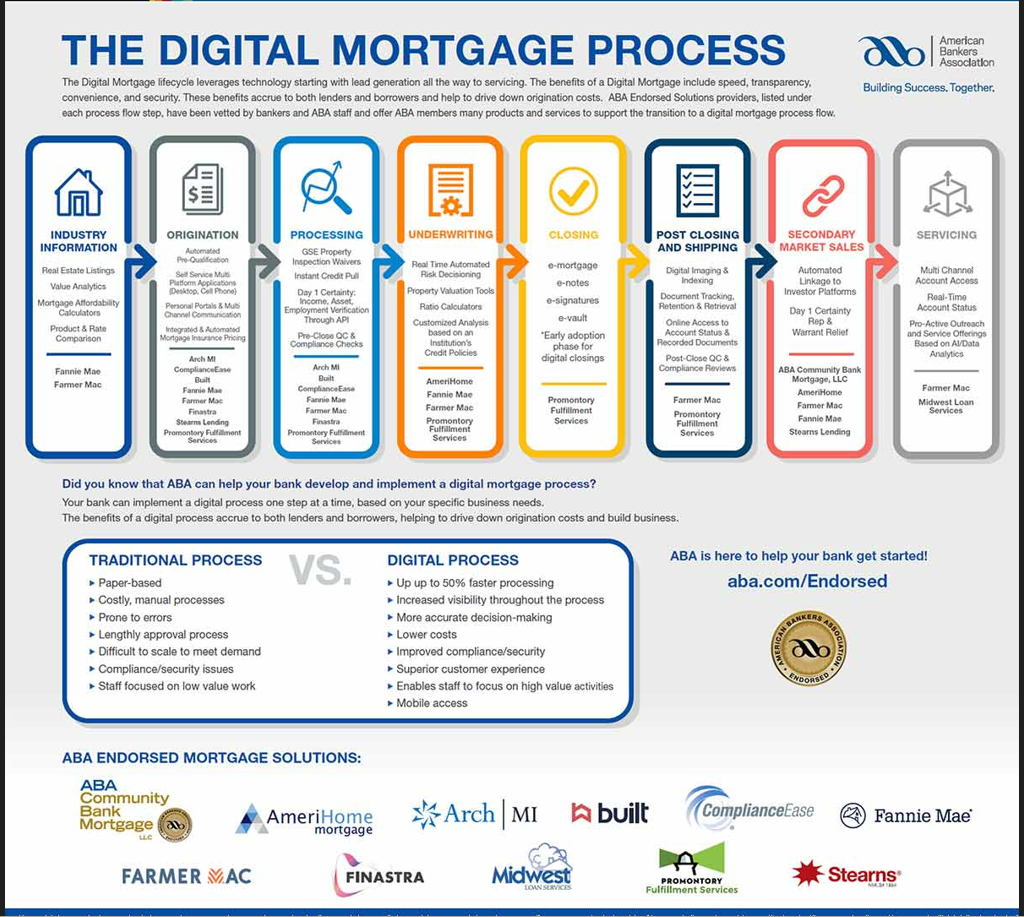
Process
This type of infographic breaks down a process into smaller step by step instructions. Process infographics help readers imagine how they can reach a larger goal, such as buying a house or saving for retirement. When creating a process infographic, just be sure to clearly label each step or instruction.
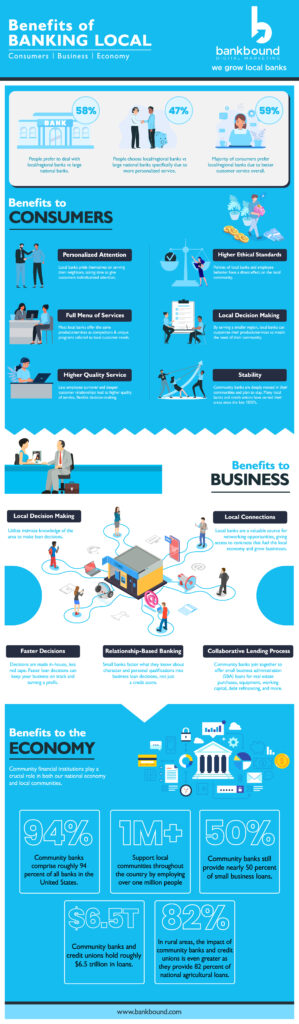
Informational
Unlike other types of infographics, this one doesn’t use numbers. Instead, it focuses on text and can cover a wide range of templates. Examples of informational infographics include instructional guidelines, brochure designs, and short videos.

Why add infographics to your content strategy?
With “Average Time On Page” about 52-54 seconds, you don’t have much time to grab the attention of visitors who land on one of your website pages.
Infographics and other visuals appeal to our brains because we can process visual content a lot faster than text. Even better, when a relevant image is paired with text, people are more likely to retain the information days later. That’s why infographics are such a one-two punch for your content strategy.
When a prospect lands on your website, help them quickly scan the content with an infographic. The faster they see that your content is relevant to the solution they’re researching, the more likely they are to stick around. In just about 7 seconds, an infographic can capture readers’ interest and tell them a story. Infographics can help us visualize any event, process, or phenomenon, highlighting only the essential points and discarding unnecessary details.
Overall, infographics are ideal for making complex data more digestible. They can explain complicated processes or present big data in a visual manner. They are also 30 times more likely to be viewed than regular text. Because of this, they are very successful in marketing and teaching materials.
Tips for an effective infographic
Follow these four tips to create effective and engaging infographics for marketing campaigns.
Tell your story
When it comes to infographics for banking, try to spark your audience’s curiosity with the story or message you’re trying to convey. Having a clear flow of data and information will make readers want to continue consuming. For example, you could include an infographic on your “About Us” page showing the timeline of your bank’s history and expansion.
Know your audience
Does your target audience respond to hard statistics, or are they driven by fun facts and pictures? The answer may change depending on whether you’re creating content for small business owners, individual consumers, etc.
With our experience serving financial institutions across the country, we’ve seen that what works visually and statistically for one audience won’t always engage another segment. So, take some time to understand your customers and prospects and how they want to take in information.
Keep it simple
The design principle known as K.I.S.S., which stands for “Keep It Simple, Stupid,” was first introduced by the US Navy in 1960. This principle is based on the idea that systems work better when kept as simple as possible. Although it’s easy to get carried away by the many possibilities for an infographic, it’s important to keep in mind that the main goal is to boil down the data.
Mix it up
Studies have shown that around 65% of the global population is capable of visual learning. This means that there are still 35% of people that you could connect with through an infographic. To keep the reader’s interest, you can add visual elements to keep the story interesting. Creating interactive infographics can enhance users’ experience–they can move through the information or story in a seamless and engaging manner.
Infographic Examples To Get You Started
Statistical:
Process:
Informational:
My infographic is done, now what?
When it comes to effective ways to use infographics, the possibilities are endless. For example, post infographics on social media to boost engagement and attract new followers. Branch employees and loan officers can use infographics to distribute information and engage with customers. Additionally, infographics can be used for your website, online advertising campaigns, and email newsletters to attract new users or bring back old ones.
Need help with Infographics and Content Marketing? Contact us!
When it comes to visual storytelling for banks, we can help you achieve your marketing goals. Our team of experienced financial content writers can help you bring potential customers to your site, engage with your existing base, and increase your brand’s awareness. We do this with innovative SEO practices and high-quality, fully customized content from webpages to infographics to blog posts. And the impacts are measurable. With analytics, we can show you the real-world results of good content, from organic visits and social media shares to search conversions and keyword rankings. Visit our Content Marketing page or reach out to us directly to learn more about all we have to offer.